Methodology
The project expanded from a 12-month study into a multi-year project,
spanning 32 months with three distinct phases in each year of the
pandemic: 2020, 2021, and 2022. Primary data collection was conducted
through a multi-cohort longitudinal survey that ran from May 2020
through December 2022. The survey was designed to be completed within a
few minutes and aimed to capture a broad range of pandemic impacts on
individuals, academic departments, and geoscience employers. In 2022,
during Phase 3, additional depth and context were added to the study
through oral history interviews and a three-part webinar series, which
gathered best practices on how individuals, academic departments, and
geoscience employers navigated pandemic-related impacts.
Multi-cohort longitudinal survey
The longitudinal survey served as the primary data collection tool for
this research study, with participants being accepted into the survey
from May 2020 through July 2022. Participants were onboarded into the
survey after completing a consent form to verify their age (18 or
older), residency in the United States, and their role as leaders of
geoscience companies, organizations, or academic departments, or as
geoscientists themselves (including students, retirees, and unemployed
geoscientists). Geoscientist participants had the opportunity to update
their occupational status by selecting one of seven occupational cohorts
on each survey: post-secondary faculty, K–12 faculty, geoscience
students, non-academic geoscientists, geoscience post-doctoral fellows,
geoscience retirees, and unemployed geoscientists.
All study participants followed a similar onboarding process. After
completing the initial consent form, participants were invited to
provide information about their occupational status in February 2020 on
the benchmark survey, and then were added to the list of participants
receiving the ongoing update surveys.
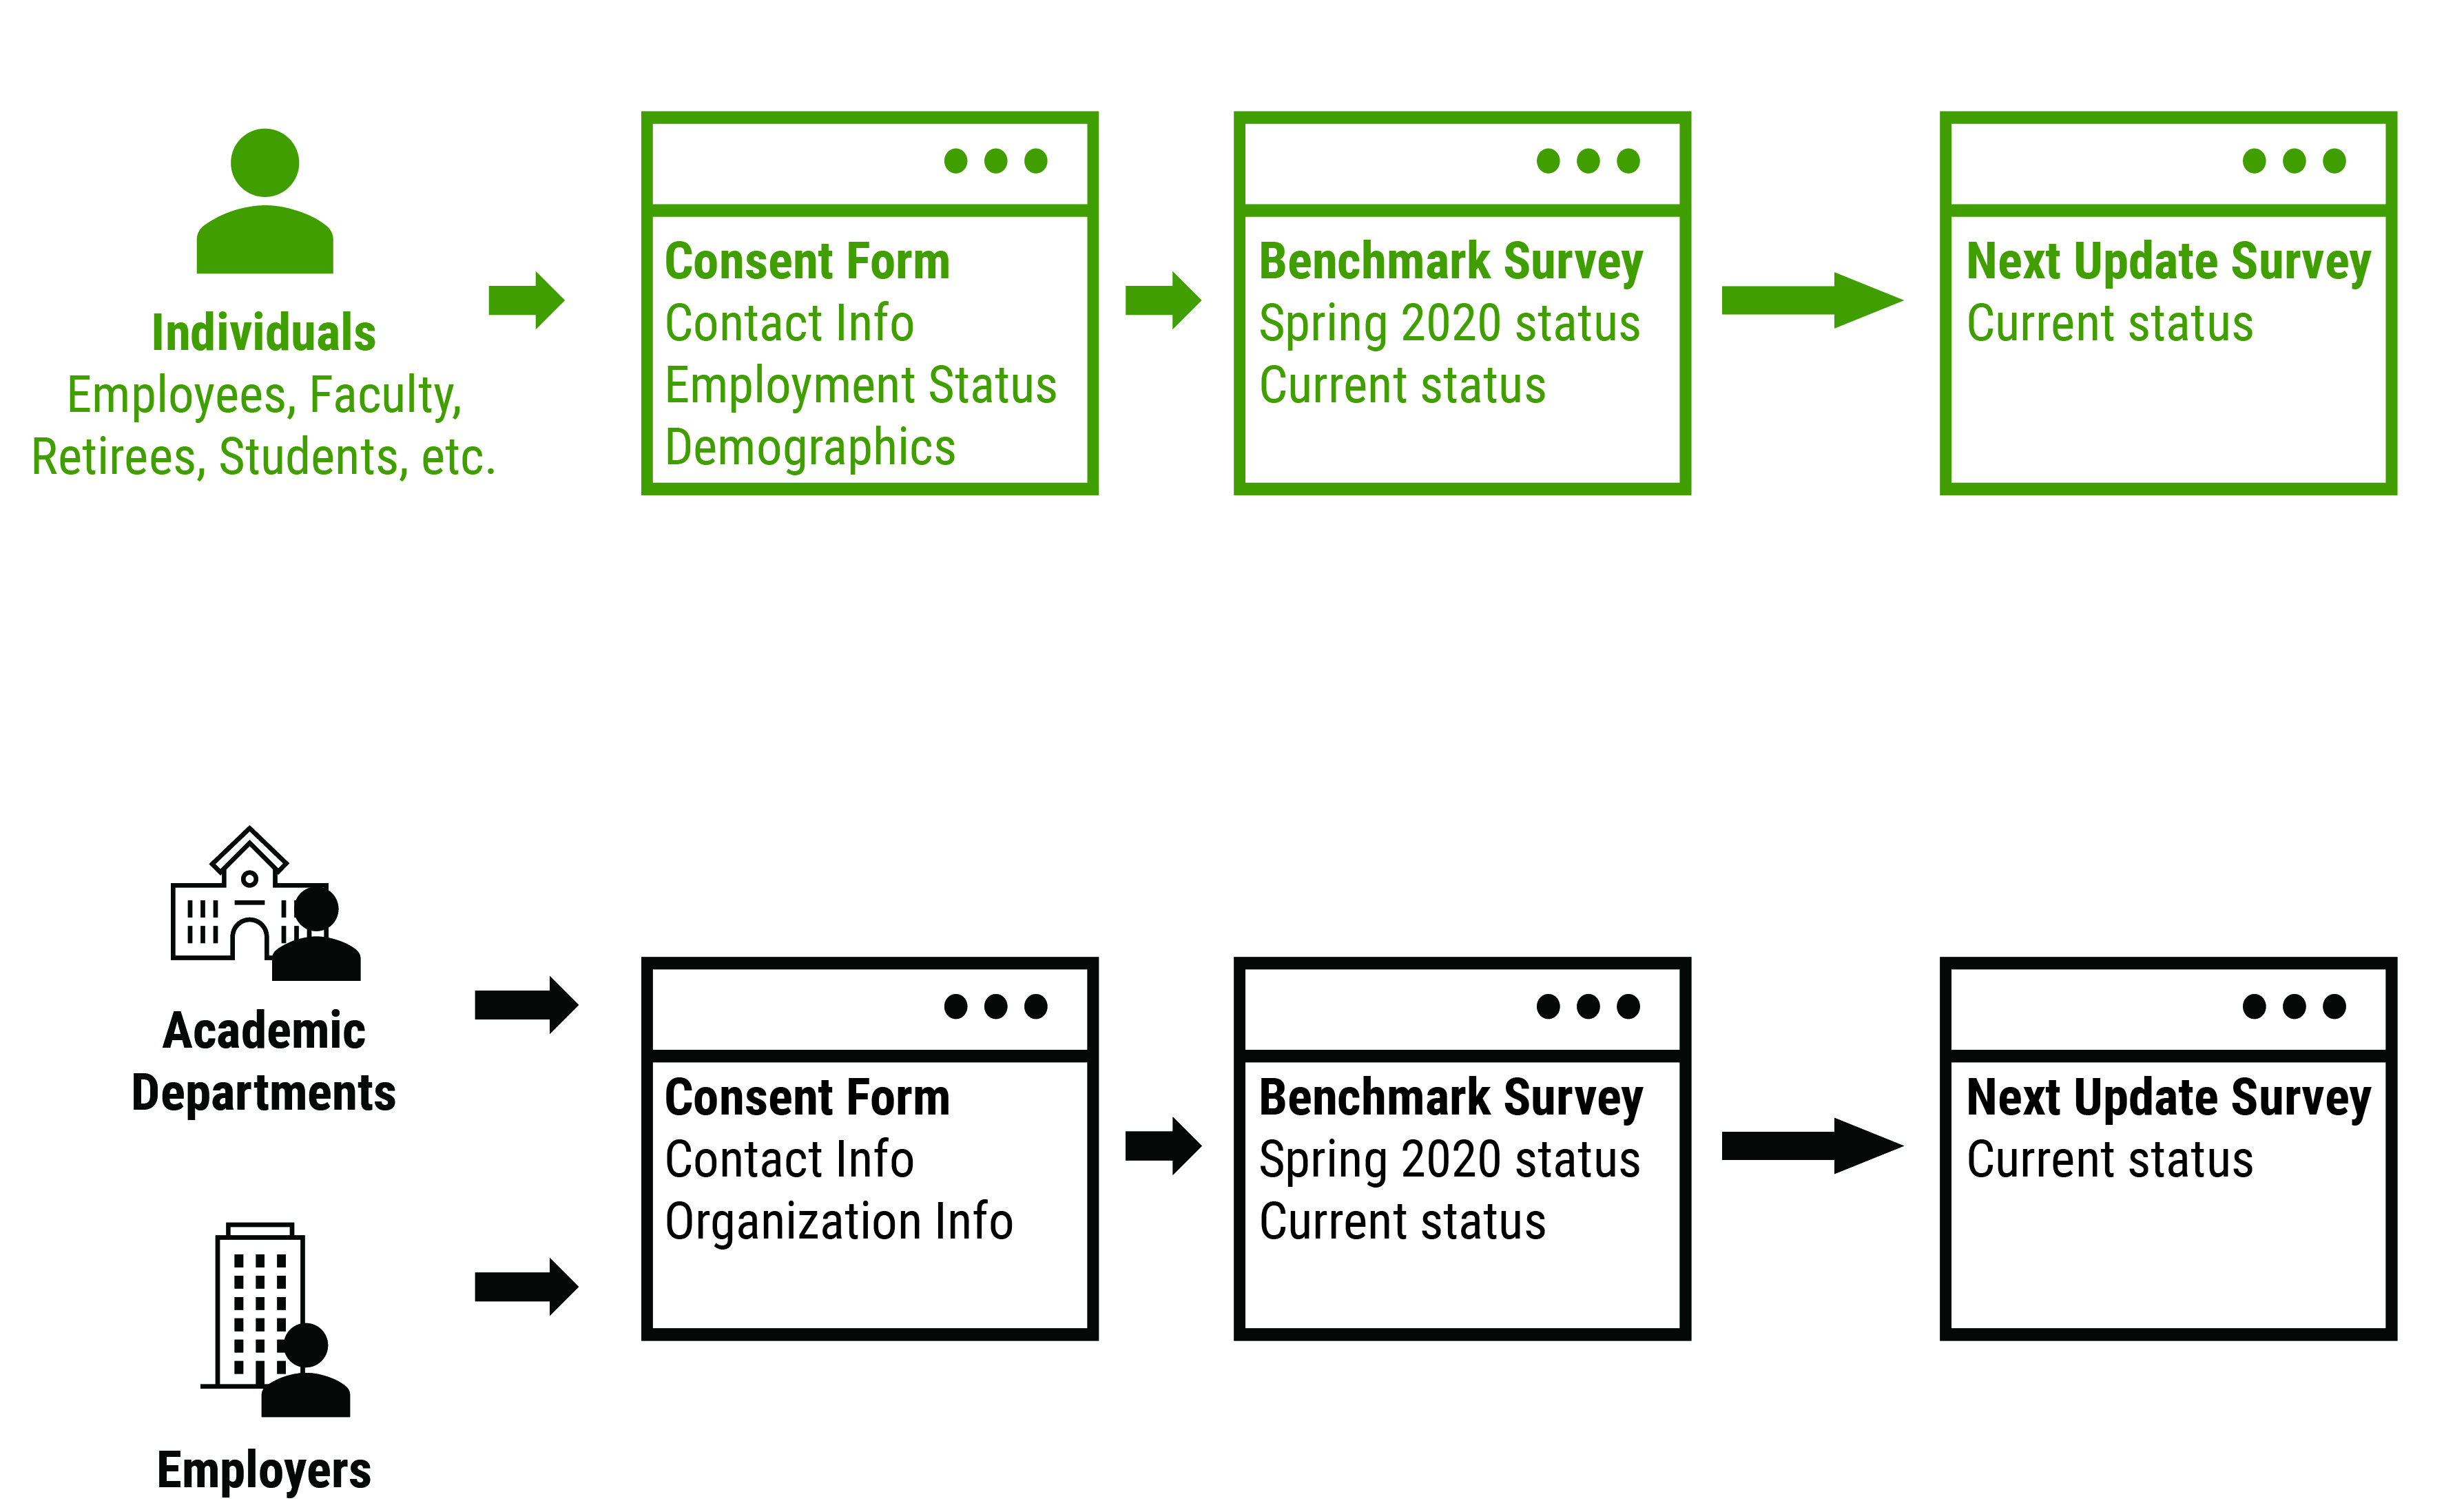
COVID Survey onboarding flow by major cohort (credit: AGI)
Survey onboarding flow by major cohortAGI
Survey onboarding flow by major cohort
Due to the rapidly changing conditions relative to the pandemic in 2020
and 2021, Phase I and II of the study involved bi-monthly surveys sent
via email to participants to gather feedback on their current
occupational status. Starting in 2022, during Phase III, participants
received monthly invitations to provide feedback on their occupational
status. The surveys were focused on demographic and factual information,
without inquiries related to health impacts or prospective views, in
order to maintain strict adherence to point-in-time factual measurements
of individuals to ensure appropriate exemption from ongoing human
subject’s review. Organization surveys allowed for the exposition of
topics such as changes to curriculum or workflow, but did not collect or
retain prospective or attitudinal data.
All identifying information, such as contact and demographic
information, was stored in a separate offline database to limit
confidentiality breach risk. Study participants were assigned unique
tokens that linked them to their survey data. Survey data was aggregated
into cohorts (i.e., academic departments, employers, academic faculty,
non-academic geoscientists, students, etc.), and where sufficient data
existed, further analyzed within sub-groupings.
A standard set of questions was developed and asked on each survey, and
once a month additional questions were included to gain deeper insights
into how individuals and organizations were adapting to workplace and
instructional changes. Whenever possible, similar or identical questions
were included across surveys for different cohorts to obtain both
individual and organizational perspectives on specific topics.
Survey question topics by major cohort and survey type (i.e., Consent, Benchmark, Next Update).
Black I's represent individual cohort surveys, blue A's represent
academic department surveys, and dark orange E's represent geoscience
employer surveys.
| Data Type |
Consent |
Benchmark |
Next Update |
| Participant Type |
I |
I |
I |
| Employment / Enrollment Status |
I |
I |
I |
| Organizational Affiliation |
I A E |
I |
I |
| Educational Background |
I |
I |
I |
| Job-seeking Activities |
I |
I |
I |
| Retiree Activities |
I |
I |
I |
| Work / Learning Environment |
n.a. |
I A E |
I A E |
| Academic Activities |
n.a. |
I A |
I A |
| Work & Research Activities |
n.a. |
I A E |
I A E |
| Professional Development |
n.a. |
I |
I |
| Outlook & Concerns |
n.a. |
I A E |
I A E |
| Contact Information |
I A E |
n.a. |
n.a. |
| Demographic Information |
I |
n.a. |
n.a. |
| Business Operations |
n.a. |
A E |
A E |
The standard set of questions asked on each survey included the
following topics:
Academic departments
- Instructional environments (teaching modes for labs, courses, field activities)
- Research activities (research cohorts and modes)
- Department operations (budget cuts, faculty searches, staffing impacts)
- Outlook (institutional status for the next academic term)
Geoscience employers
- Business operations (financial performance, productivity)
- Staffing impacts (changes in permanent and temporary staff, travel, and field activities)
- Strategies for addressing COVID-19 impacts
- Work environment options for employees
Individuals (i.e., academic faculty, students, post-doctoral fellows,
K–12 faculty, non-academic geoscientist, retired geoscientist,
unemployed geoscientists)
- Employment / enrollment status
- Occupational affiliation (non-students only)
- Educational affiliation including school, degree, and fellowship/scholarship information (students only)
- Work or instructional environment (location, mode)
- Instructional modes for courses, labs, and field experiences
- Work and research activities (modes, COVID-19 restrictions, protocols)
- Engagement with co-curricular and professional development activities
- Institutional plans for the next academic term (faculty and students only)
- Degree completion impacts and plans for the next academic term (students only)
Recruitment and retention strategies
Each phase of the study included new recruitment efforts to onboard
additional participants into the survey and other data collection
components. During Phase I, invitations to participate in the survey
were sent to over 800 U.S. degree-granting and community-college
geoscience programs for distribution to their faculty, students, and
alumni. Invitations to participate were also sent to AGI’s member
societies and to AGI’s network of over 124,000 geoscience professionals.
Project staff also solicited the following 25 organizations to assist in
additional efforts to raise awareness of the study through social media,
posts to listservs, and newsletters to their membership. These
organizations included AGI member society organizations as well as other
state and local geoscience organizations.
- Alabama Geological Society
- American Association of Geographers
- American Association of Petroleum Geologists
- American Meteorological Society
- Association for Women Geoscientists
- Association of Earth Science Editors
- American Geophysical Union
- American Institute of Professional Geologists
- Association of American State Geologists
- Central Oregon Geoscience Society
- Earth Science Information Partners
- Geochemical Society
- Geological Society of America
- Geoscience Information Society
- International Medical Geology Association
- National Association of Geoscience Teachers
- National Association of State Boards of Geology
- National Ground Water Association
- New York State Geological Association
- Society of Economic Geologists
- Society of Exploration Geophysicists
- Society of Vertebrate Paleontology
- The Geological Society of Washington
- Utah Geological Association
- Vermont Geological Society
In Phases II and III, additional recruitment was conducted through AGI’s
network of contacts, outreach partnering organizations, and AGI’s member
societies. In-person recruitment efforts for the ongoing survey and for
the oral history and webinar series components of the study were also
made through presentations at the annual meetings of the Geological
Society of America and American Geophysical Union.
Because the study spanned over two and a half years of data collection,
retention efforts were put in place to help keep survey participants
engaged throughout the study. These strategies included monthly emails
to study participants that highlighted the latest study results, social
media posts, and emails to AGI’s network of contacts featuring AGI’s
Geoscience Currents data briefs that provided the recent analysis of
survey data. Survey results were also presented at webinars, research
forums, and at the annual meetings of the Geological Society of America
and American Geophysical Union to aid in recruitment and retention
efforts and to disseminate the information to the wider geoscience
community.
Survey participation
The survey included a total of 97 academic departments, 119 geoscience
employers, and 1,648 individuals as participants. Participants were not
required to complete every survey, and in fact over the course of the
study, participants tended to respond more frequently during periods of
increased pandemic activity or significant changes in their lives. As
such, participants were flagged as active or inactive depending upon
survey completion frequency. Active survey participants were defined as
those who completed at least two surveys during the study. There were 84
active participants representing academic departments, 98 active
participants representing geoscience employers, and 1,441 active survey
participants who were individuals.
To calculate response rates in a way that took into consideration the
participants' varying survey completion rates, a chained response rate
methodology was used. The number of active participants (those who
completed at least two surveys) was divided by the total number of
consents for each cohort. The chained response rate was 87% for academic
departments and individuals, and 82% for geoscience employers.
Links to relevant survey data charts
Survey participants by cohort
Chained response rate by cohort
Demographics of geoscience academic departments
A total of 97 geoscience academic departments from 4-year and 2-year
higher education institutions participated in the study, providing
insights about how the pandemic affected departmental operations and
instructional environments. Approximately one-third of academic
departments were in each major Carnegie Classification category, with
35% in doctoral universities, 31% in master’s colleges, and 34% in
baccalaureate or associate’s colleges. The majority of departments
granted bachelor’s degrees (82%), while 43% granted master’s degrees and
28% granted doctoral degrees. Academic departments were located in 35
states and Puerto Rico, with the largest representation of departments
located in New York, California, Texas, and Pennsylvania.
Comparing the representation of academic departments in the study with
AGI's Directory of Geoscience Departments revealed similar
representation at Hispanic-serving institutions (HSI), lower
representation among Asian American and Native American Pacific
Islander-serving institutions (AANAPISI), and slightly higher
representation among Native American-serving non-tribal institutions
(NASNTI). In the study, there was no representation of academic
departments from Tribal Colleges and Universities (TCU), Predominantly
Black Institutions (PBI), historically Black colleges or universities
(HBCU), or Alaska Native-serving institutions or Native Hawaiian-serving
institutions (ANNH).
Links to relevant survey data charts
Academic departments by institutional Carnegie Classification
Academic departments by degree granting status
Academic departments by state
Academic departments in minority-serving institutions
Demographics of geoscience employers
A total of 119 geoscience employers participated in the study, providing
insights into how the pandemic affected their business operations,
staffing, and hiring between 2020 and 2022. These employers were located
in 35 states and Puerto Rico, with the highest concentrations in
California, Texas, and Colorado. Most employers (74%) were small
employers with 50 or fewer employees, while 26% had over 50 employees.
Geoscience employers represented 11 industry sectors. According to data
from the 2021 U.S. Bureau of Labor Statistics Employment Projections
dataset, the four primary sectors within which geoscientists work are
professional, scientific, and technical services (40%), government
agencies (28%), mining and oil & gas extraction (5%), and
educational services (17%). Geoscience employers participating in the
study showed similar representation to federal data in the
professional, scientific, and technical services and government
agencies sectors. However, there was an over-representation of
employers in the mining and oil & gas extraction and the non-profit
organizations (i.e., other services, except public administration)
sectors compared to the federal data. Sectors represented by employers
in the survey included professional, scientific, and technical
services (44%), government agencies (21%), non-profit
organizations (i.e., other services, except public administration)
(14%), mining and oil & gas extraction (13%), and educational
services (3%). Given AGI’s promotion of the Geoscience COVID-19 study
to its member societies, the high proportion of non-profit organizations
relative to federal data participating as employers in the study is not
surprising. In addition, the lower representation among the educational
services sector was because academic departments were included in a
separate survey cohort.
Links to relevant survey data charts
Geoscience employers by state
Employer size by number of employees
Employment sectors of geoscience employers vs employed geoscientists in the US
Demographics of individual survey participants
A total of 1,648 individuals participated in the study, providing
insights into how the pandemic affected their workplace and
instructional environments from 2020 through 2022. At the time they
joined the study, participants consisted of non-academic geoscientists
(over a third), academic faculty at colleges and universities (just over
a quarter), and students (14%). Over the course of the pandemic, there
were changes in the occupational types of participants, particularly for
graduating students and early-career geoscientists who transitioned into
new jobs, enrolled in new degree programs, or experienced periods of
unemployment. Unfortunately, participation of post-doctoral fellows was
particularly low (2% of the study participants at the time of survey
consent) throughout the study, despite targeted attempts at recruitment
and retention.
Most geoscientists working in non-academic occupations worked in core
geoscience occupations at the time of survey consent (96%), with most
working as geoscientists, and 20% working as geoscience managers. Those
working in non-core occupations frequently reported using their
geoscience knowledge and skills in their job or working within the
profession in a non-core capacity. In terms of representation across
industry sectors, when compared with the 2021 U.S. Bureau of Labor
Statistics Employment Projections dataset, study participants were
over-represented in the following sectors: government agencies,
especially state governments (26% vs 11%) and federal government
agencies (13% vs. 7%), non-profit organizations (i.e., other
services, except public administration) (8% vs 2%), colleges and
universities (12% vs 8%), and mining and oil & gas extraction (8% vs.
5%), and educational services (3%). Survey participants were
under-represented relative to the federal data in the professional,
scientific, technical services sector (22% vs. 40%), educational
services (0% vs 9%), and local government agencies (4% vs 10%).
In terms of age distribution, individual survey participants were
relatively evenly distributed across age brackets. Gender distribution
was nearly equal between male and female participants, with an
additional 1% of participants identifying as non-binary. Participants
were predominantly non-Hispanic (90%) and White (88%). Hispanic
participants accounted for 4% of the total, while 4% belonged to other
under-represented racial groups. Study participants were
under-represented when compared to the 2019 occupational data from the
U.S. Bureau of Labor Statistics for environmental scientists and
geoscientists which indicated that 12% of the occupation was of Hispanic
heritage and 5% was Black or African-American. In terms of citizenship,
95% of participants were U.S. citizens while 4% were either permanent
residents or non-permanent residents.
Links to relevant survey data charts
Participants by occupational type at time of survey consent
Occupations of non-academic geoscientists at time of survey consent
Employment sectors of non-academic geoscientists vs employed geoscientists in the US
Participants by age at time of survey consent
Participants by gender
Participants by Hispanic heritage
Participants by race
Participants by citizenship status
References
Gonzales, L., Keane, C., 2020. Diversity in the Geosciences, Geoscience
Currents, 2020-023, American Geosciences Institute. https://www.americangeosciences.org/geoscience-currents/diversity-geosciences
Oral histories
In 2022, during Phase III of the study, we conducted 40 oral history
interviews to capture the firsthand experiences of geoscientists as they
navigated the impacts of the pandemic on their work and research
activities. Interviewees shared strategies they used to overcome
pandemic-related challenges and discussed the new opportunities for work
and research that arose as a result of changes brought about by the
pandemic. The oral histories included the experiences of geoscience
employers, academic departments, academic faculty, recent geoscience
graduates, post-doctoral fellows, non-academic geoscientists, and K–12
educators. Oral history contributors were provided the option to
publicly release their transcripts to the study’s
project website
and 16 contributors agreed to do so.
Oral histories are invaluable for providing insight into changes within
organizations and communities that are often challenging to capture
through traditional surveying techniques (Webster, 2016). Oral histories
offer unique perspectives into cultural shifts and nuances within
organizations and communities that may not be fully expressed through
surveys alone due to variances between expression of values versus
actual actions (Corritore et al., 2020). The oral histories focused on
the interviewees’ experiences related to pandemic impacts on their work
and research activities, including strategies for overcoming
pandemic-related challenges, and new opportunities for work and research
that arose from the pandemic. For employers and departments, there was
an additional focus on how they navigated restrictions and revenue
setbacks to ensure operational continuity. These focused interviews
provided valuable insights into the consistent changes, adaptations,
activities, and behaviors of survey participants and their respective
organizations.
Candidates for the oral histories were recruited from the existing pool
of survey participants as well as from the broader geoscience community.
Oral history applicants completed a consent form and initial screening
process to ensure that they met the criteria for the oral history
interview, namely, residing in the United States, being over 18 years
old, and working within the geosciences or representing a geoscience
academic department or employer. Oral history interviews were recorded,
machine-transcribed and manually checked and corrected for clarity and
accuracy. The transcripts were used for qualitative analysis to extract
relevant trends in changes to work and research environments over the
course of the pandemic. Interviewees who agreed to publicly release
their oral history transcript were given the opportunity to review and
lightly edit their transcripts for clarity and accuracy for public
record.
Links to relevant survey data charts
Oral history participants by cohort
References
Corritore, Matthew, Amir Goldberg, Srivastava, Sameer. 2020. The New
Analytics of Culture. Harvard Business Review. https://hbr.org/2020/01/the-new-analytics-of-culture
Webster, Jessica Wagner. 2016. “Filling the Gaps”: Oral Histories and
Underdocumented Populations in The American Archivist, 1938–2011. The
American Archivist. 79 (2): 254–282. doi: 10.17723/0360-9081-79.2.254
Webinar series
In Fall 2022, during Phase III of the study, project staff organized and
hosted a three-part webinar series that focused on gathering the best
practices and adaptations to overcoming pandemic-related impacts across
academic and workforce sectors. As the focus of the webinar series was
on data collection rather than dissemination, the format of the events
was centered on discussion topics which the panelists and attendees
reflected upon and shared their experiences. The first webinar focused
on insights from recent graduates and postdocs, the second on academic
faculty and departments, and the third on geoscience employers. The
series included 11 panelists who represented the study’s main cohorts.
The series attracted 150 registrants and 43 attendees, primarily from
the US higher education sector.
The webinars were recorded and machine-transcribed, and the transcripts
were manually checked and corrected for clarity and accuracy. The
transcripts were used for qualitative analysis to extract both the
challenges faced by individuals, departments, and employers and the
strategies they used to overcome and navigate through the
pandemic-related obstacles they encountered.
Links to relevant survey data charts
Webinar series participants by cohort and employment sector