Data Brief 2020-013 | August 5, 2020 | Written and compiled by Leila Gonzales and Christopher Keane, AGI, August 2020
Download Data Brief
A National View of Geoscience Workforce Changes during COVID-19
Using federal data sets to examine COVID-19 impacts on the geoscience workforce
Federal datasets provide a broad view of workforce and economic trends
and usually provide data on annual or quarterly granularity, although
some provide monthly data. While their coarse granularity does not make
them very useful for high-frequency, occupation-specific analysis, these
datasets are useful for providing a baseline of longer-term trends for
comparison with finer-resolution data.
For an overview of federal data related to changes in the geoscience
workforce in 2020, we use a combination of data from the U.S. Bureau of
Labor Statistics, U.S. Department of Labor, and the U.S. Census Bureau
to provide a larger context for the results of the ongoing Geoscience
COVID-19 longitudinal study.
Geoscience representation across industry sectors
While geoscientists work in nearly all economic sectors, data from the
most recent Occupational Employment Statistics dataset from the U.S.
Bureau of Labor Statistics indicate that most geoscientists work in four
sectors: professional, scientific, and technical services; public
administration; mining, quarrying, and oil and gas extraction (often
referred to only as mining); and educational services. Self-employed
geoscientists are not included in this dataset.
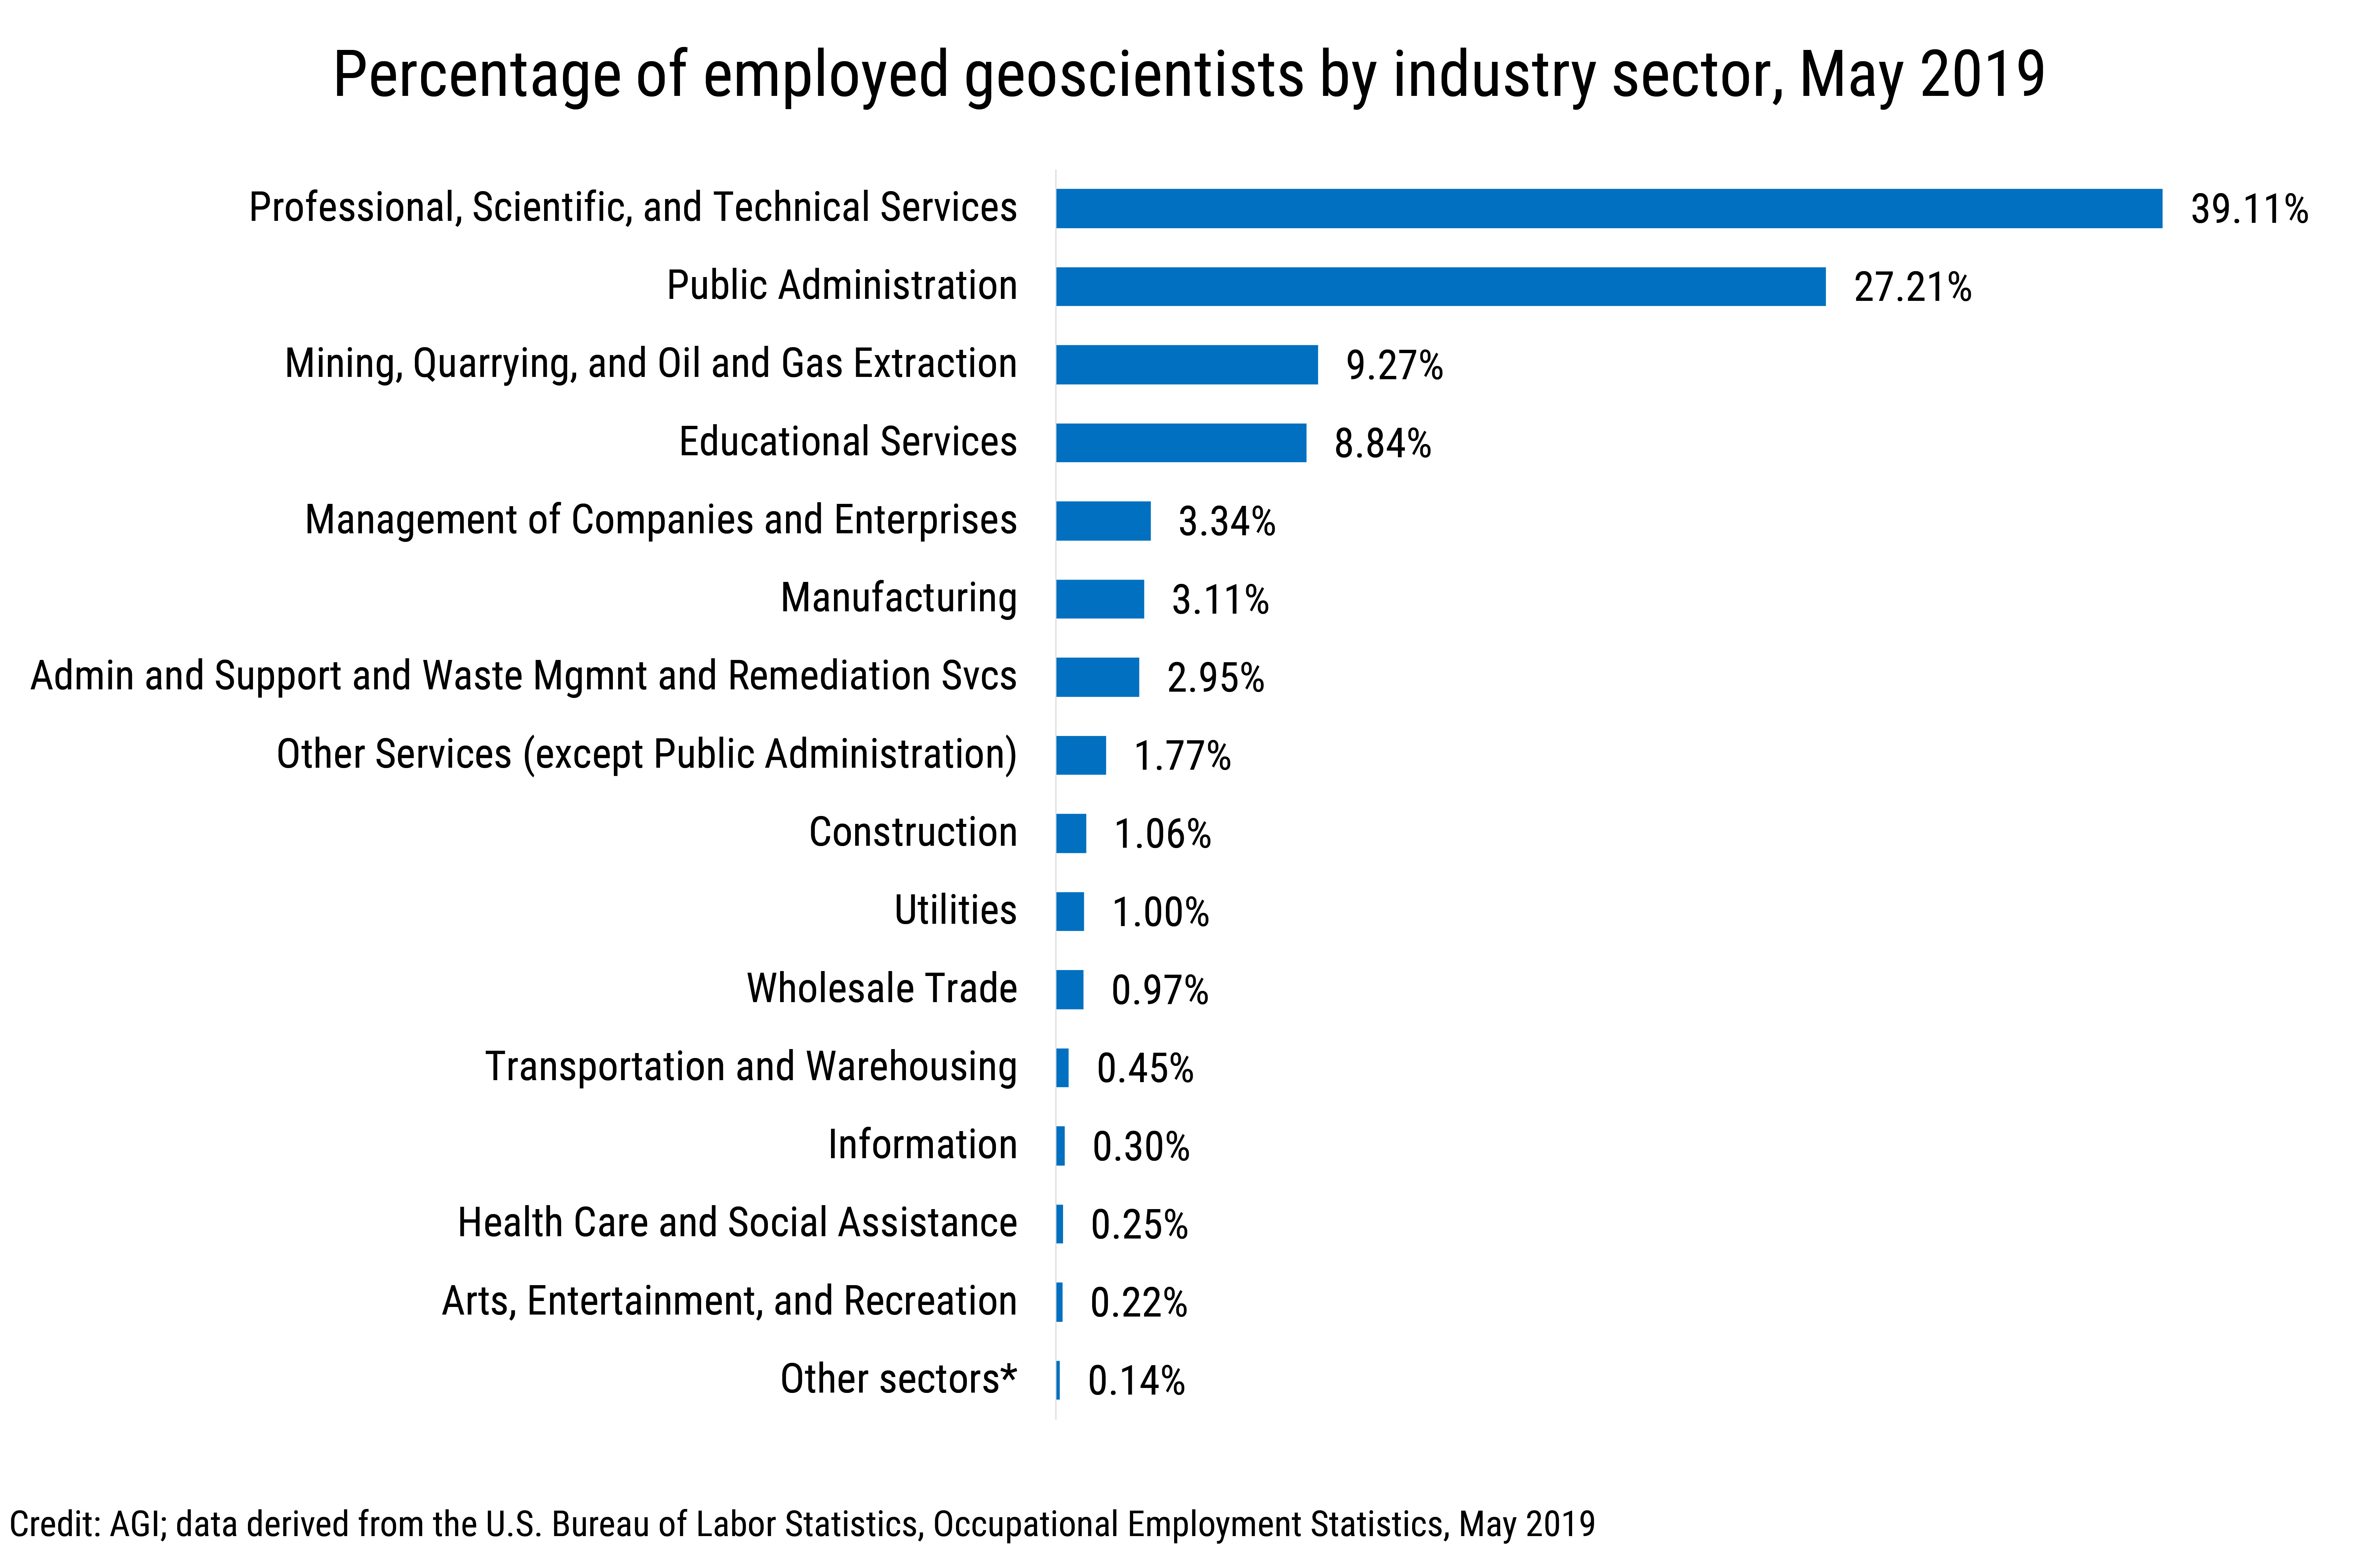
Data Brief 2020-013 chart-01: Percentage of employed geoscientists by industry sector, May 2019 (Credit: AGI, data derived from the U.S. Bureau of Labor Statistics, Occupational Employment Statistics, May 2019)
AGI
Note that “Other sectors*” includes sectors with less than 0.1% of
employed geoscientists. These sectors are: Agriculture, Forestry,
Fishing and Hunting: 0.05%, Retail Trade: 0.01%, Finance and
Insurance: 0.07%; and Accommodation and Food Services: 0.002%.
Monthly employment trends by occupation
The U.S. Census Bureau’s Current Population Survey provides monthly
employment data; however, only some occupational categories are
reported monthly, while others are reported less frequently throughout
the year. Within geoscience occupations, several occupational
categories, primarily engineering and managerial positions, are reported
more frequently than all other geoscience occupations. Geoscience
employment as a whole and occupations within the solid-earth geosciences
generally follow the trend of early reporting geoscience occupations in
year-over-year changes in monthly employment.
Year-over-year changes in employment for early reporting geoscience
occupations increased through April 2020 thereafter declining sharply
through June 2020. Other federal datasets which provide employment and
unemployment data by industry sector show a sharp inflection point in
April 2020 as the impacts from COVID-19 hit all sectors. It is important
to note that despite the large decline from April through June 2020, the
year-over-year reported employment change for geoscience occupations is
still positive relative to 2019.
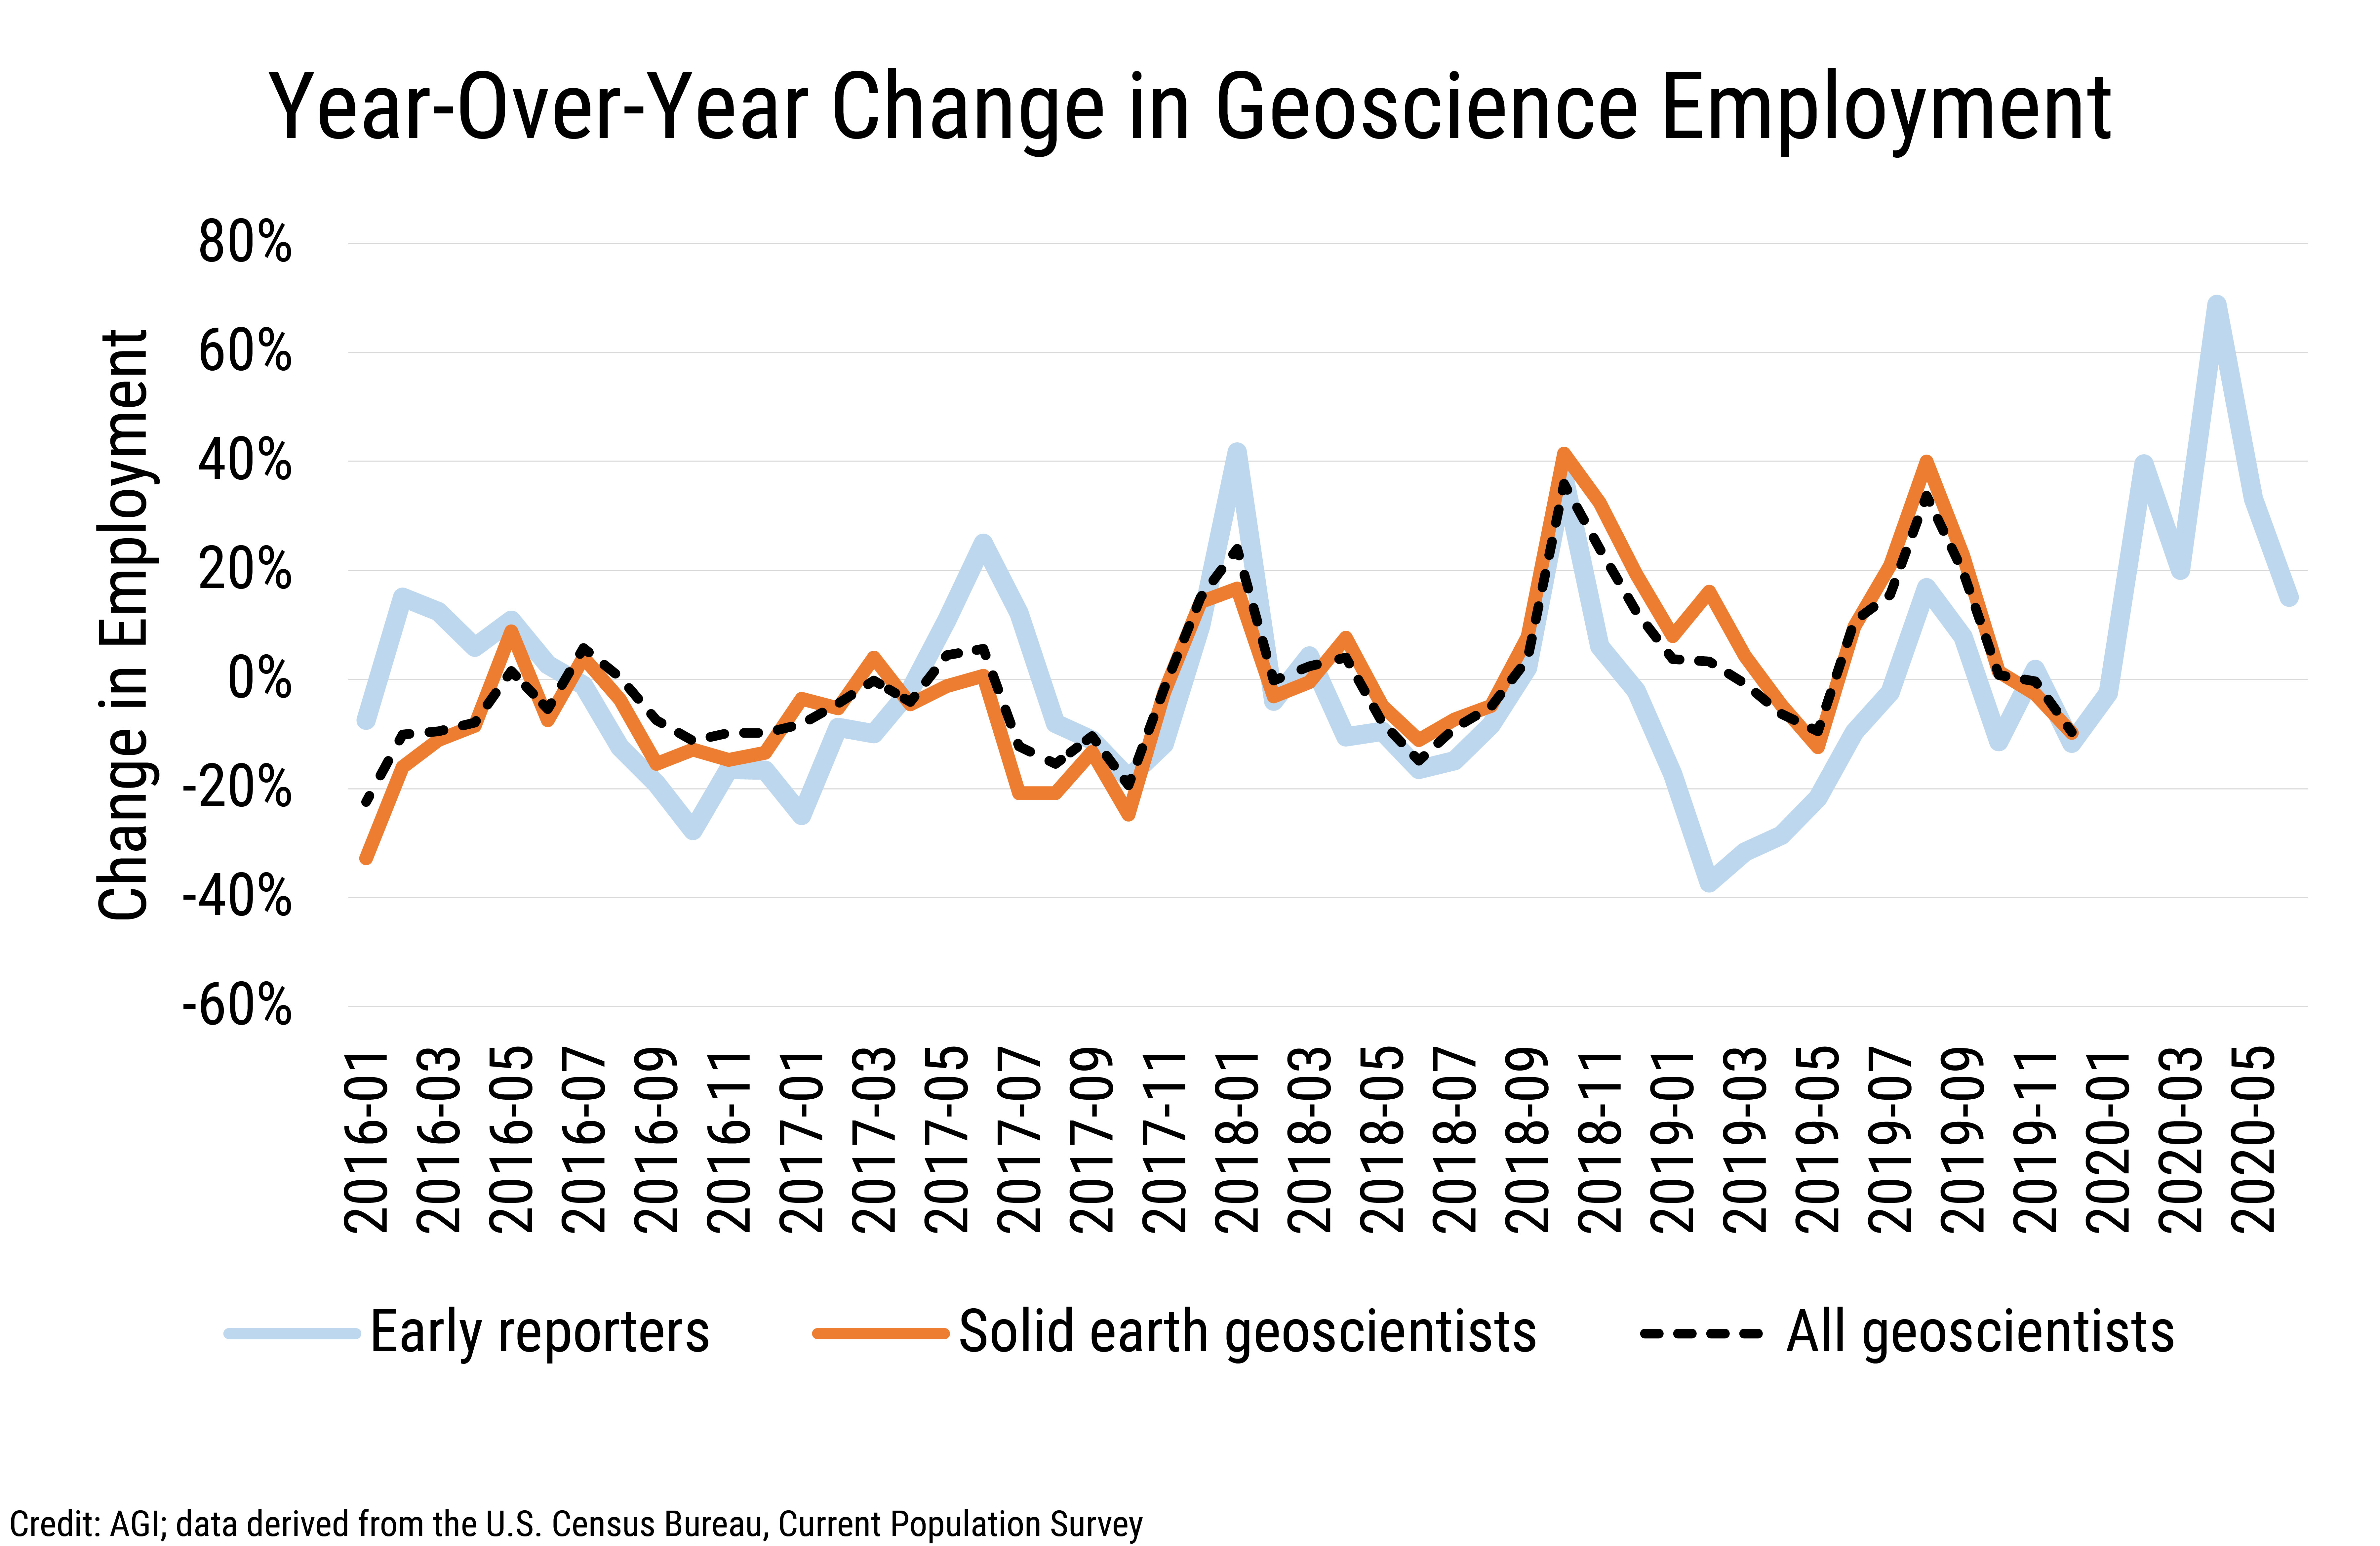
Data Brief 2020-013 chart-02: Year-Over-Year Change in Geoscience Employment (Credit: AGI, data derived from the U.S. Census Bureau, Current Population Survey)
AGI
Unemployment insurance claims by industry
Data from the U.S. Department of Labor’s Characteristics of Unemployment
Insurance Claimants dataset show the COVID-19 pandemic impacting nearly
all industrial sectors in April 2020, with some earlier impacts,
especially for the accommodation and food services sector in March.
The hardest hit sectors in April 2020 that showed year-over-year
increases in unemployment insurance claims in excess of 1000% were
accommodation and food services; other services (except public
administration); arts, entertainment and recreation; healthcare and
social assistance; retail trade; educational services; and
manufacturing. In May 2020, there were an additional three sectors
showing year-over-year increases in unemployment insurance claims in
excess of 1000%, and these were transportation and warehousing,
management of companies and enterprises, and mining (which includes
oil and gas operations).
The four sectors in which most geoscientists work (professional,
scientific, and technical services; public administration; mining; and
educational services) historically comprise 9-12% of total monthly
unemployment claims. In April and May of 2020, these sectors comprised
6% and 7% respectively of total unemployment claims. Of these four
sectors, the educational services and mining sectors showed the
largest year-over-year increases in unemployment claims during April and
May 2020. This federal dataset does not provide sufficient granularity
to evaluate subsector impacts during this period.
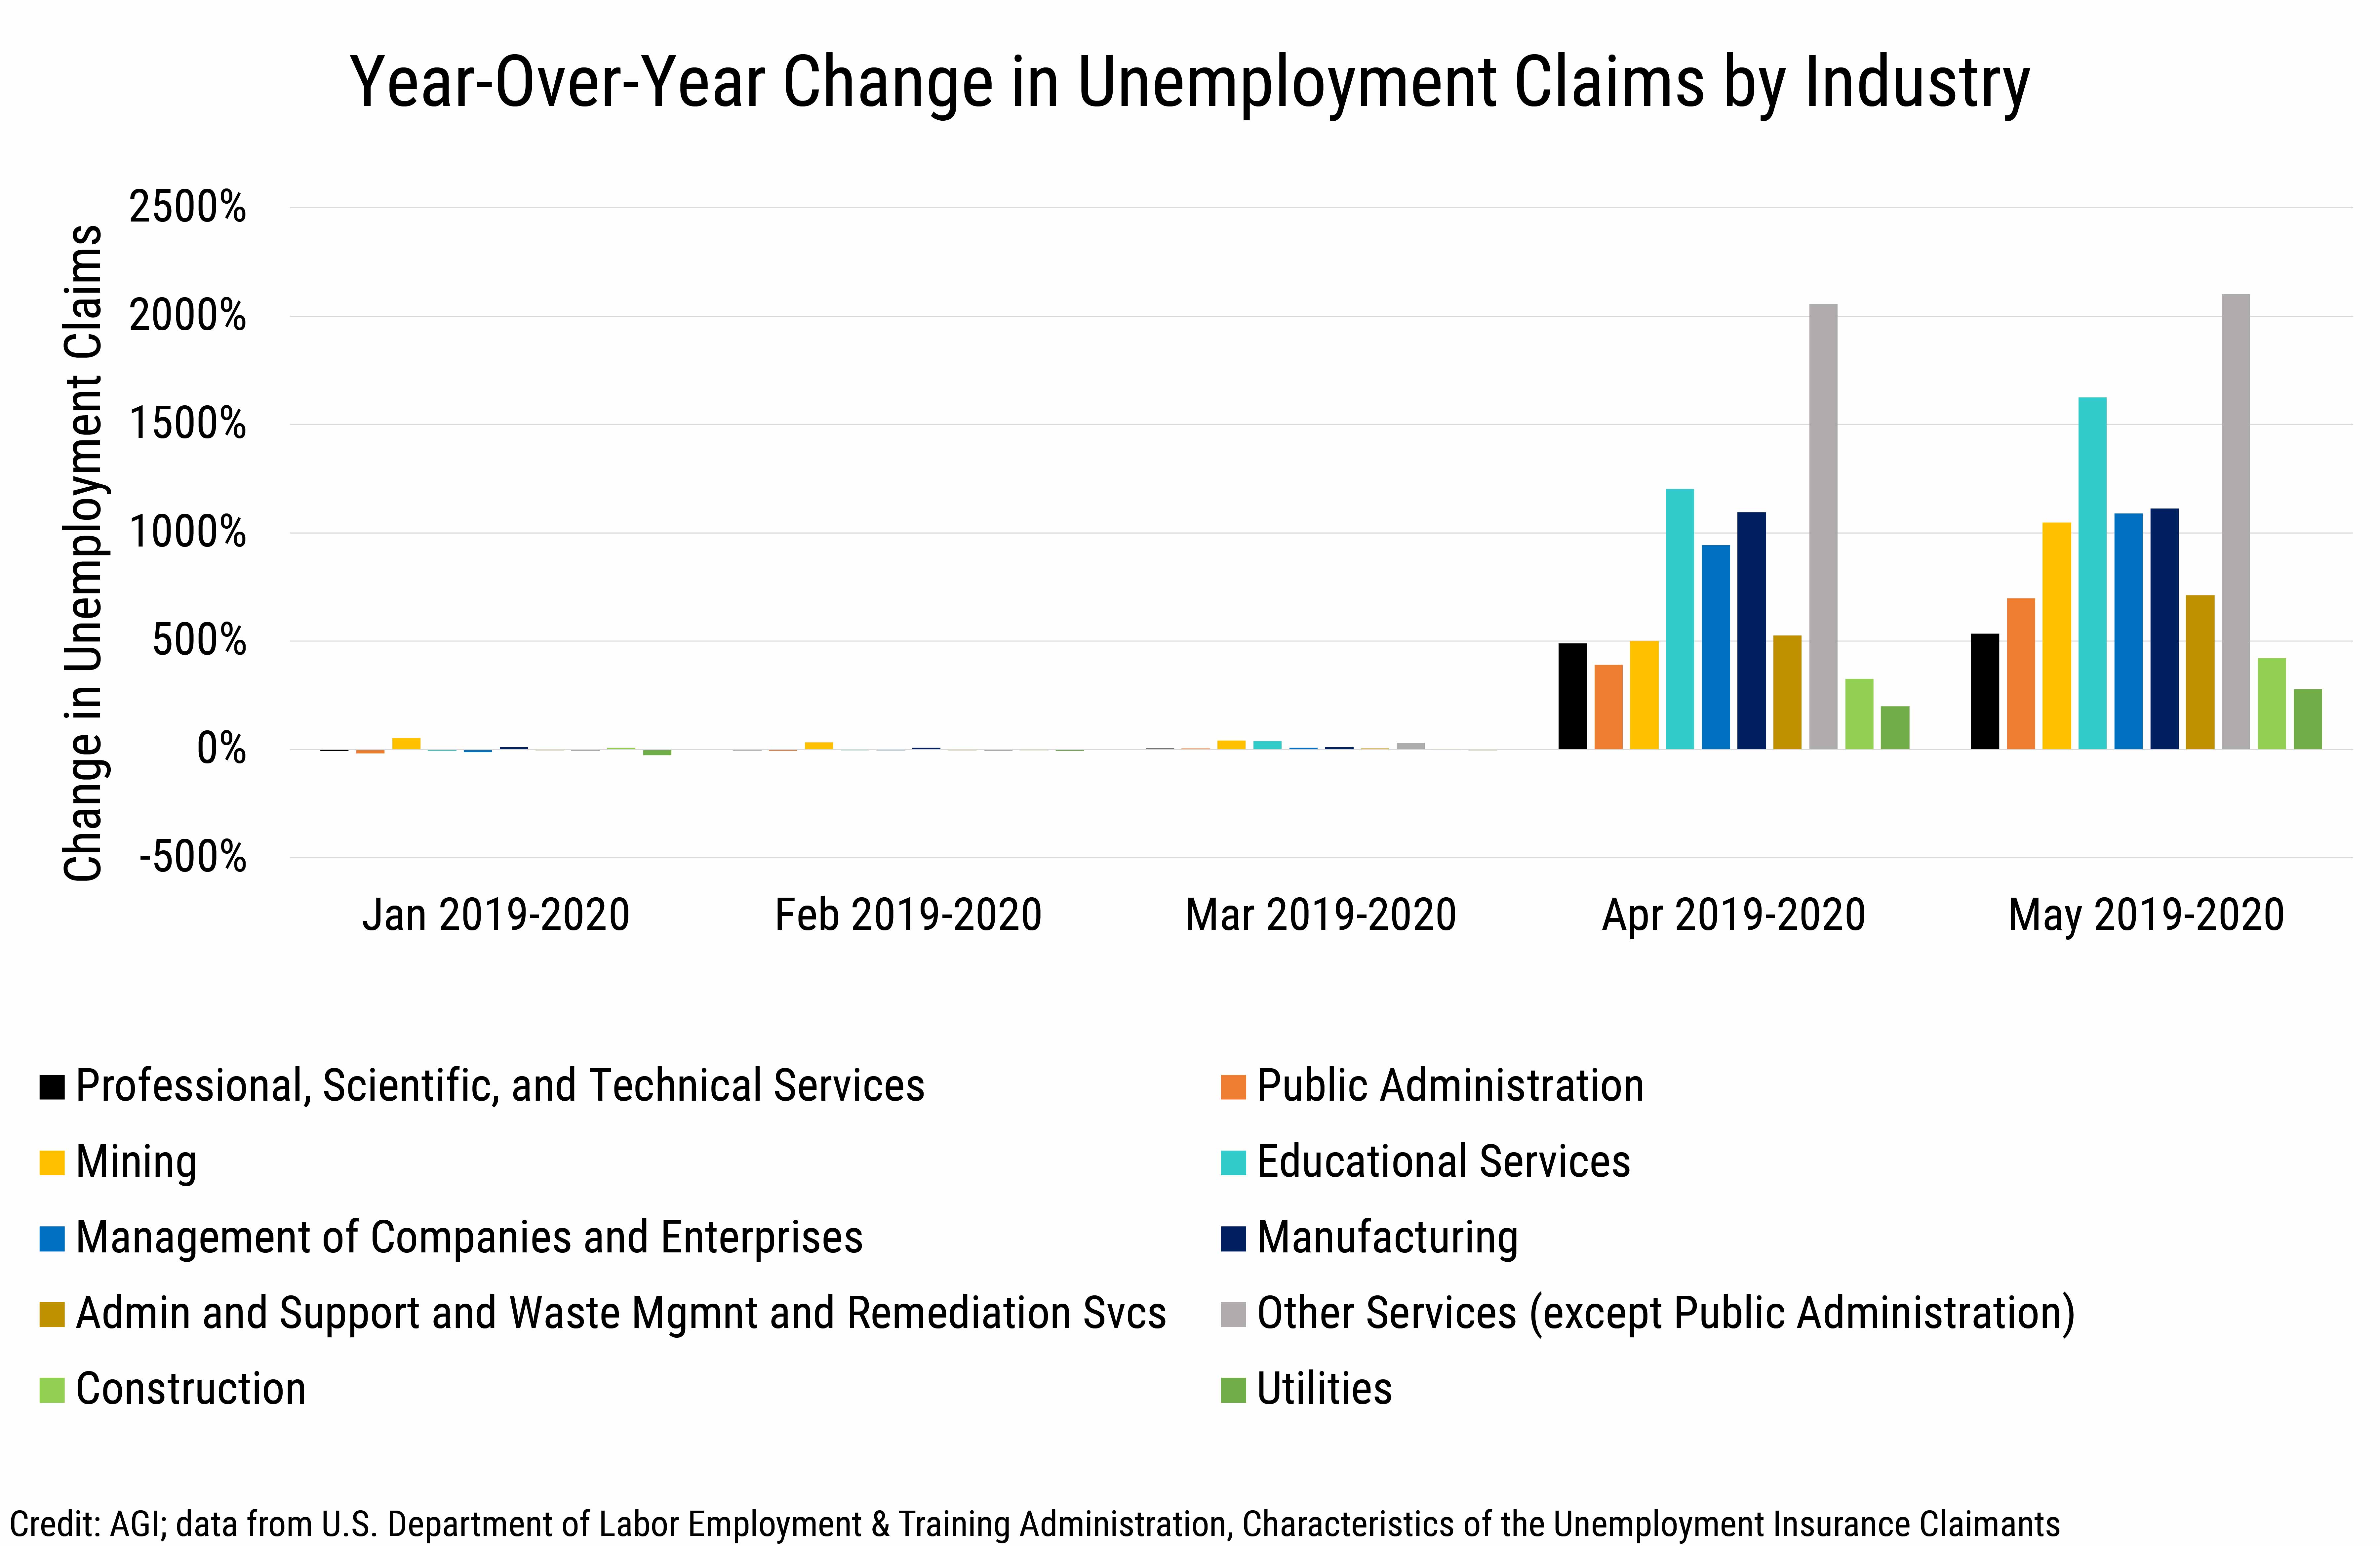
Data Brief 2020-013_rev20201119 chart-03: Year-Over-Year Change in Unemployment Claims by Industry (Credit: AGI, data derived from the U.S. DOLETA, Characteristics of the Unemployment Insurance Claimants)
AGI
Employment trends by industry
The U.S. Bureau of Labor Statistics’ Current Employment Statistics
dataset provides monthly employment data by both broad and detailed
industry sectors. In Figure 4 below, we focus on the four main industry
sectors within which most geoscientists work. Employment impacts are
seen across nearly all of these sectors in April 2020, with an exception
of oil and gas, scientific research and development services, and
federal and state government. In April 2020, the largest
year-over-year declines in employment were in the support activities
for mining sector (-24%), which includes support activities for oil
and gas operations, and in the specialized design services sector
(-13%).
While employment trends in many industry subsectors either stabilized or
began to show signs of rebounding from April’s declines in May and June,
declines in employment continued for four industries: oil and gas
extraction, support activities for mining, computer systems design and
related services, and local government. Employment in the oil and
gas extraction sector, although having a positive year-over-year
employment change from 2019, declined from 9% in March 2020 to 2% in
June 2020.
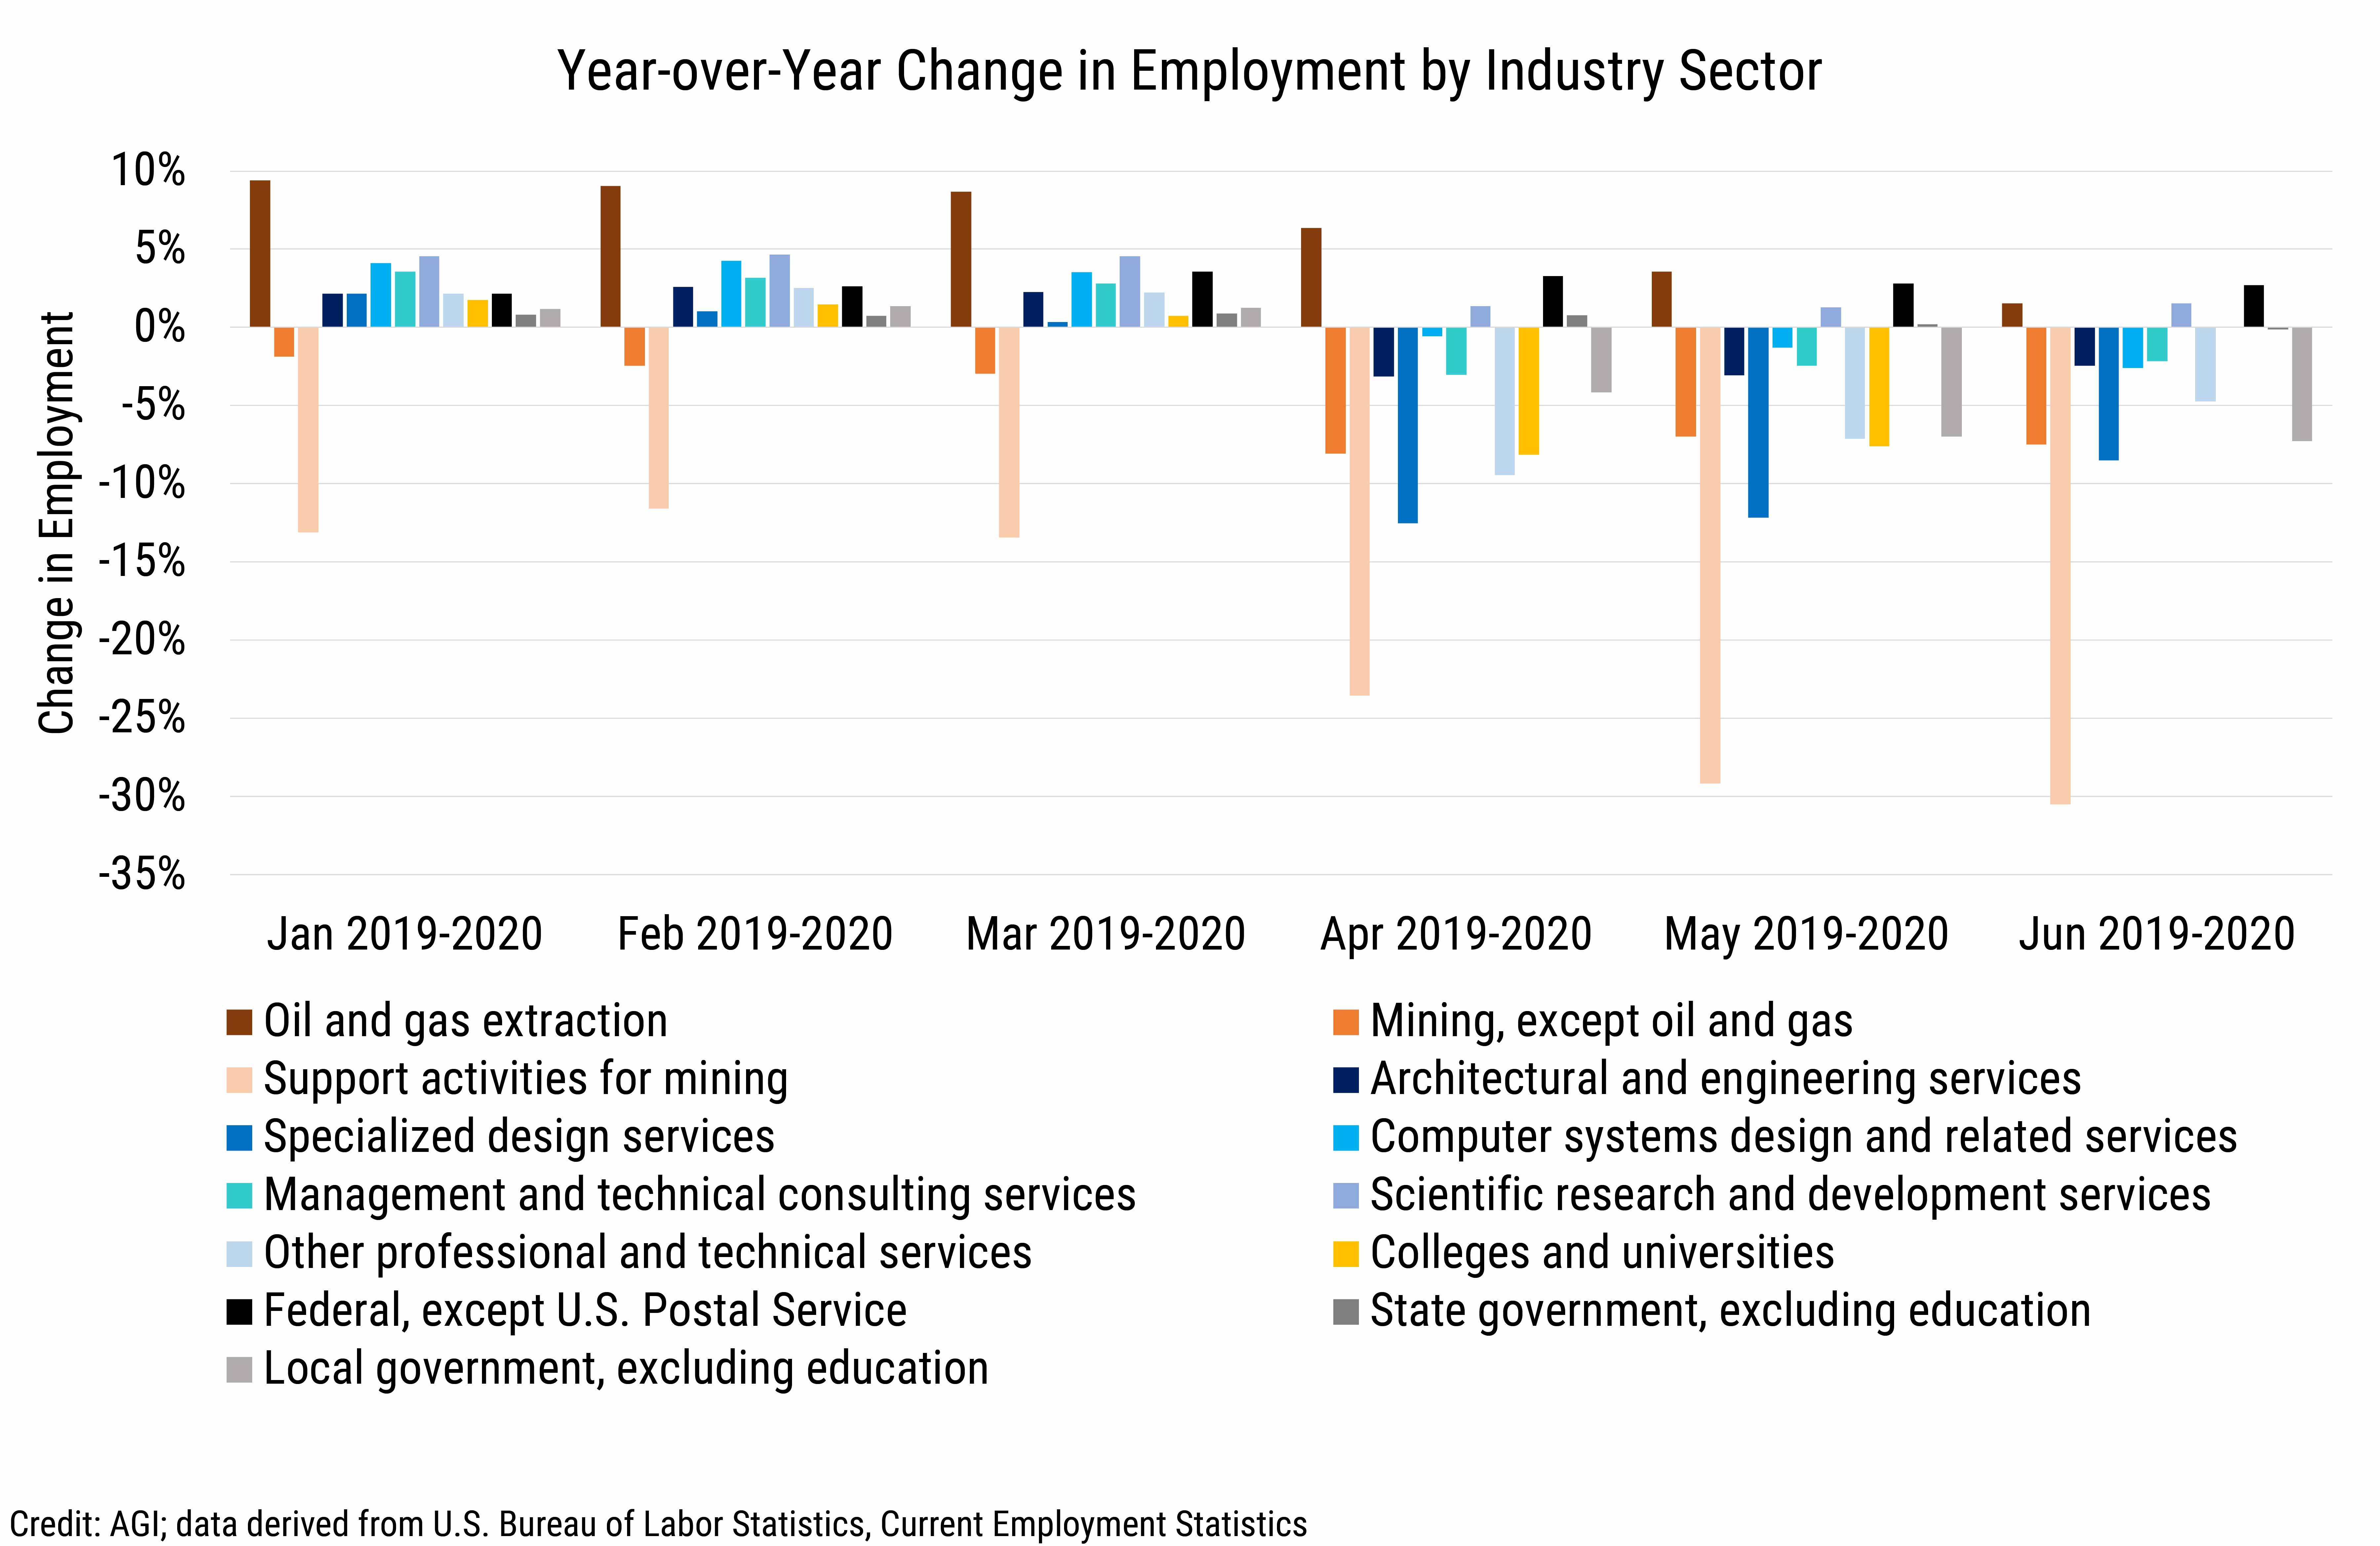
Data Brief 2020-013 chart-04: Year-Over-Year Change in Employment by Industry Sector (Credit: AGI, data derived from U.S. Bureau of Labor Statistics, Current Employment Statistics)
AGI
Industries shown are those where at least 1% of employed geoscientists
work (see Figure 1). The professional, scientific, and technical
services, public administration, mining, and educational services
sectors are where 84% of geoscientists work.
The support activities for mining sector provides services for mining
and quarrying of minerals and for oil and gas extraction activities, and
this also includes exploration activities such as geophysical surveying
and mapping, core sampling, and geological investigations at prospective
sites. Year-over-year employment declines in this sector began in August
2019 at -4% and further declined to -12% in December 2019. This pattern
may indicate impacts from declines in oil prices that started the end of
2019 which is likely compounded by impacts from the COVID-19 pandemic.
Within the professional, scientific, and technical consulting sector,
the largest employment declines were in the specialized design
services (-13%) and other professional, scientific and technical
services (-9%) subsectors, both of which are not typically industries
within which geoscientists work.
Employment declines in the coal mining sector drove the overall
declines in the mining, except oil and gas sector, with year-over-year
declines in this subsector between 19% and 14% between April and June
2020. The metal ore mining and nonmetallic mineral mining and
quarrying sector had declines of only 4-5% over this same period.
We will continue to provide current snapshots on the impacts of COVID-19
on the geoscience enterprise throughout the year. For more information,
and to participate in the study, please visit:
www.americangeosciences.org/workforce/covid19
Funding for this project is provided by the National Science Foundation
(Award #2029570). The results and interpretation of the survey are the
views of the American Geosciences Institute and not those of the
National Science Foundation.